
Root Cause Analysis Tools (RCA Tools)
If you’re looking to improve processes in your business, you’ll need to look beyond the obvious symptoms and find out what’s actually not working. Root cause analysis tools are perfect for that.
In this article, we’ll discuss the following tools:
- The 5 Whys
- The Gemba Walk
- The Pareto Chart
- The Fishbone Diagram
- The Cause and Effect Matrix
What is Root Cause Analysis
Root Cause Analysis (RCA) is an analysis tool attempts to find the root cause of any process defect or inefficiency. The techniques described in this blog post aim to ensure that you treat the actual disease, not only the symptoms.
Imagine you are an e-commerce company, and one day, you find that a product series in your online shop has incorrect prices and wrong pictures.
The first step is to analyze and fix the issue at hand. But in a second step, you want to prevent that from happening again in the future.
To find effective solutions for the future and fix the symptoms of a problem, you first need to understand what exactly went wrong. This is what root cause analysis does. It is the toolkit to determine the real cause of the problem.
The goal is to prevent a problem that has happened once from occurring again. In order to apply Root Cause Analysis, it is required that you already have identified what your problem is.
This means you have to be clear about which issue you want to address. Root Cause Analysis then provides the tools for process analysis that are the basis for your problem-solving efforts.
QUALITATIVE VS. QUANTITATIVE TOOLS
Generally, you can divide root cause analysis techniques into quantitative tools that rely on data and statistics on the one hand and qualitative tools that rely on logic and reasoning on the other hand.
The data quality and availability for many smaller businesses might not be sufficient to use quantitative tools so that this article will focus more on the qualitative tools. In most cases, you will have enough information to start using them right away.
The 5 Whys
One of the most straightforward and most effective root cause analysis process to arrive at the root cause of the problem is the 5-Whys Method.
HOW IT WORKS
You start with the problem statement. Write down the problem for which you want to find the possible causes. When you have written it down, ask “Why” five times, iterating closer to the root cause. Imagine it to be like kids do it.
The following is a simple example of a 5-Whys analysis:
Problem: The milk is empty.
Why? We used more this week than we bought.
Why? We used a lot of milk for some shakes but didn’t buy extra milk for this.
Why? Because the person who wanted the shakes didn’t write the extra milk on the shopping list.
Why? He didn’t have access to the shopping list because it wasn’t at home.
Why? Dad took the list to go grocery shopping.
In a next step, you can take this possible root cause and do something about it.
PROS AND CONS
On the plus side, the 5-Why Method is very engaging and intuitive for your team to work with. It is an easy way to find a variety of possible causes.
The last point is also a downside for the 5 Whys: Depending on how you answer the questions, you might arrive at an endless number of possible root causes.
So it’s necessary to run through the process more than once to give alternative outcomes a chance. Do that together with your team in a brainstorm session.
We will have a look at more structured approaches further down.
The Gemba Walk
Another powerful technique is the so-called Gemba walk. If quality issues arise, walk (literally, walk) to where the problems took place and see for yourself what’s going on.
It may sound silly but think this through: If your third party logistics company messes things up, then visit them.
If your customer support gets terrible reviews, take a few hours and sit next to your representatives as they take the calls. And then: Observe and listen.
If your operations are remote, check out our blog post on Remote Gemba.
HOW IT WORKS
This technique, also called management by walking around, is intuitive and easy to perform for manufacturing processes or tasks that require physical movement of goods, material or people. It’s part of the lean methodology. The steps are as follows:
- Let your team know that you will do a Gemba walk and plan your walk by following the value stream
- Focus on the process and its flaws, not the people.
- Make notes and document your observations using a checklist
- Ask questions, listen and observe – don’t suggest corrective action during the walk (unless you find a safety hazard)
PROS AND CONS
One advantage of the Gemba Walk is that you get first-hand information about how a process is performed and become an eye-witness to any shortcomings the current process might have.
So if the root cause of a problem lies in how the work is being performed, it’s likely that you find it during a Gemba walk.
One disadvantage is the effort you need to put in to travel or at least walk to the Gemba physically.
Also, the concept can be challenging when transferred to remote or office setups where labor isn’t necessarily visible, and work has no specific place where it is performed.
The Pareto Chart
You are probably familiar with the Pareto principle: it says that 80% of the outcome are usually achieved with 20% of the input. As a result, you have to put in 80% of the work to reach the last 20% result.
This principle holds in many domains (customers and the revenue they bring, hours worked to quality of outcome, etc.) Thus, the Pareto principle is a great way to focus your efforts on the input that creates the most significant output.
HOW IT WORKS
The Pareto Chart is a visual representation of the Pareto analysis for your very operation or problem. It is the only tool in this blog post that requires you to have some numerical data.
It is especially useful when you don’t have only one, but many causes for your problem, and you want to decide which ones to focus on. These different problems are failure modes – different ways in which your process produces a defective outcome.
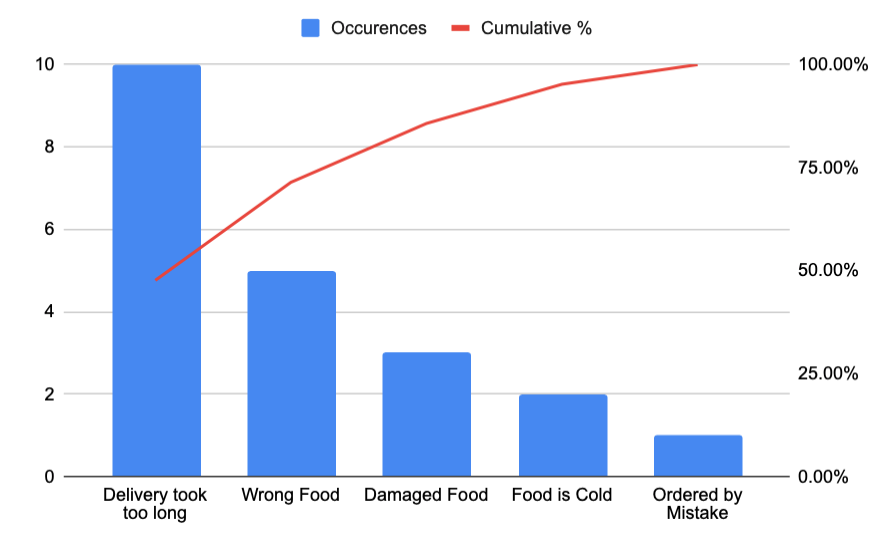
To display and prioritize these different failure modes, you set up a bar chart graph that displays occurrences of defects or other problems you have, e.g. reasons for customer complaints.
The number of occurrences is on the y-axis, while the category of defect is on the x-axis. Sort the categories by decreasing occurrence quantity from left to right.
Now you add a line graph that represents the cumulative percentage of all defects, adding up the values of the bars on the left to arrive at the overall percentage of defects (you will need a second y-axis).
What this will give you is the set of defects to focus on because they make up 80% of your problems: All categories left of where the line crosses the 80% mark.
PROS AND CONS
Even though it’s a data-driven tool, the Pareto Chart is easy to use. It tells you which of the possible causes for a problem are the ones to focus on.
On the downside, the Pareto Chart is not a tool to find the root causes of your business problems but put the ones you already know in perspective and make continuous improvement. Therefore, it’s not a stand-alone tool but best combined with one of the other qualitative tools in this post.
The Fishbone Diagram
The fishbone diagram, also often called Ishikawa Diagram after its inventor, is a cause-and-effect diagram that allows you to systematically collect potential causes for a specific outcome – in our case, root causes for your problem.
HOW IT WORKS
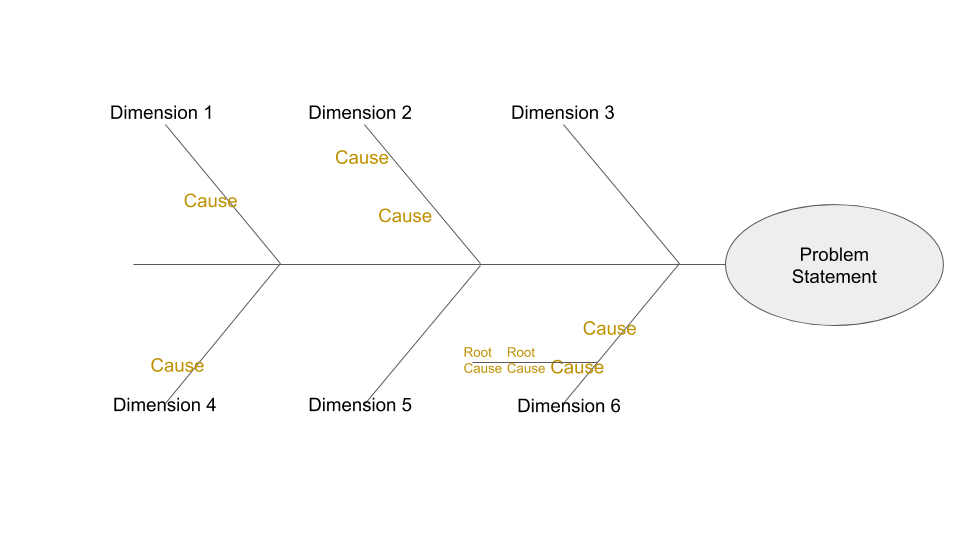
You start with a structure that looks like a fishbone. Depending on your industry, there are different ways to name the branches.
In manufacturing, the 8 Ms are very common: You name each branch with one of the dimensions Man, Machine, Material, Method, Measurement, Mother Nature (for the environment), Management and Maintenance.
If you are in a different industry, you might use other dimensions (4S for service, 8P for Products, etc.). It is your decision what dimensions you use; the only important thing is that they’re not redundant, and cover all critical areas of your operation. The problem statement is the fish-head on the right.
Once you have the dimensions, you work through each of the dimensions and put the possible causes for the problem onto the branch. If you have more than one per dimension, write down all of them. If you can identify root causes to the causes, it’s a great idea to add sub-branches.
PROS AND CONS
The fishbone diagram gives you a great framework to work through all possible areas where causes might lie for a certain problem. It helps you not to miss an area, and it enables you to see the whole picture at a glance.
A disadvantage is that it will not help you to dig deeper than the first level of observation. To fix this, combine it with the 5 Whys technique to find all the possible causes of the problem.
Cause and Effect Matrix
The Cause and Effect Matrix is another excellent tool to weigh different input factors regarding their impact on the output.
HOW IT WORKS
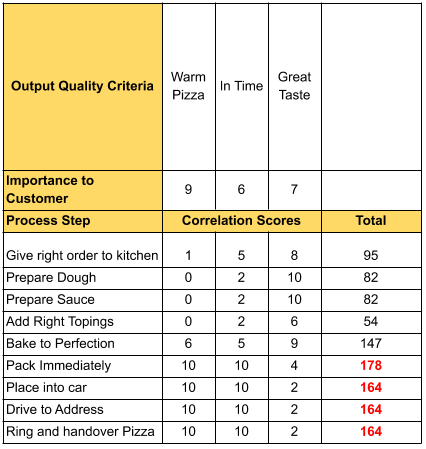
You set up a matrix that has the parameters that are critical to quality (CTQ) as columns. They are weighted with the relevance they have for, let’s say, customer satisfaction; you might use another dimension to weight them. These parameters are your functions or results.
As rows, you list down all your possible process steps that are involved in your process. They are your variables.
Next, you fill out the cells with a number between 0 and 10 that states how closely correlated the input (process step) is to that column’s output.
0 means no correlation, 10 means high correlation. Ask yourself: How much will my result for the parameter at the top change when there’s a variation in the process step in a row.
Finally, you multiply the correlation score with the weight numbers of the columns and add the products to arrive at a total score per row.
What this cause and effect analysis will give you is a clear picture of what input factors are critical for the quality that your customer experiences.
PROS AND CONS
Again a very structured approach to things you might diffusely know but couldn’t nail down. The Cause and Effect Matrix will give you a clear idea of which input factors to focus on; in that regard, it is similar to the Pareto diagram.
Also, it can help you with risk management – you know which process steps you’ve got to keep in check to ensure consistent quality.
The disadvantage is similar to the Pareto diagram as well: The Cause and Effect Matrix will not help you find root causes, but to rate them by importance.
Find the mix of analysis methods that works for you
Which tools work best for you is a question of personal taste and the problem at hand. We suggest trying each tool and see how well it works for you and your team.
In most cases, it makes sense to combine those qualitative tools. We have not touched on the topic of qualitative/statistical/analytical tools. They are a great addition to these tools but require more data to work with.
KNOWLEDGE ALONE WON’T SOLVE YOUR PROBLEMS
Once you have defined the root causes of problems, the next step has to be that you set up an action plan to tackle them, including the right change management approach.
Check out our blog post on how to improve business processes here. Your final goal is not identifying the root causes of defects by inspection but finding ways to prevent them from happening altogether.
The goal is to build quality and improvement into your processes and not rely on quality control.
Best
Benjamin